Analytics is not an assembly line. You cannot disassemble an analytical problem and hand it out to a set of different humans and have them all come back together with an answer. Well, you can—but you can’t expect this to get you good outcomes. Analytics cannot be effectively treated as an assembly line because analytics is an iterative process that involves asking and answering questions, gathering data, poking at it, getting curious, getting stuck in dead ends, and realizing that the fact you learned way over here is actually the answer to this question way over there. Analytics requires a neural network—currently, a human!—interacting with a really good computer. And neural networks do not cleanly submit to industrial logic, to mechanization. When you try to treat analytics like an assembly line you do get predictable outcomes (likely dashboards!), but not insights that drive ROI. You certainly don’t get agility or velocity. Insight, agility, and velocity in analytics require curiosity, flexibility, integration. The best data teams allow talented people to flex between these different roles. They allow them to take an idea and get curious about it, to explore it without needing to file a ticket or wait for anyone else. Getting stuck in someone else’s queue is where non-linear ideas goes to die. This section, and the encouragement from a LinkedIn Post, led me to write about why analytics should be an assembly line.
Foreword
Before getting too deep, I do think it’s worth highlighting a number of prerequisite readings and arguments. If you haven’t read all of these articles I will briefly give a summary and set some necessary framing. I believe it’s worth reading them as it makes it easier to grok the case I’m trying to make.
These pieces highlight several important concepts. The main one is that there exists a practice called “Statistical Process Control” (SPC) which enables you to understand your business in such a way that you understand its controllable levers. This is what we would call true “business intelligence”. SPC is built on metrics that describe real business processes.
The goal of SPC is to identify exceptional variation, as opposed to routine variation, in business processes. When exceptional variation is identified it is then the job of the data team to investigate and see what caused it. A product of this investigation is often a new metric (or several).
This whole process is a huge shift in how to think about a business and what a data team should do. I encourage you, again, to read the prerequisites as it isn’t always immediately obvious why SPC is right. To take the framing from Emilie’s article, SPC is what she’d call “Reporting”. Reporting isn’t something you do that’s separate from creating insights and predictions – it’s the necessary first step and foundation that wholly enables insights and prediction. And Reporting is often where the largest amount of time and effort is spent on data teams.
If you’re with me so far, then we’ve got the foundation necessary to frame the “analytics should be an assembly line” argument. That said, my argument here is not the whole story. As any data professional knows, even ones who practice SPC, working with your non-data peers and convincing them to look at and use your dashboards is a large part of the job; that is the “socio” part of the sociotechnical challenge of being a data professional. By treating the reporting part of the job as an assembly line, we create additional space for the more challenging parts of the role and enable us to bring excellent outcomes to more people.
Introduction
Analytics as an assembly line is about centering the fact that most companies and data professionals should be focusing on the basics: consistently measuring their business via metrics, aka descriptive analytics. The majority of companies do not measure their business well, if at all.
I know this because I talk to dozens of companies every week that are not your typical, venture-backed B2B SaaS. What we modern data professionals consider normal is, in fact, very advanced and out of reach for many companies. The overexuberance of the past decade of the Modern Data Stack *cough* I mean the Analytics Stack has moved the needle for some companies, but not most.
Tristan paints a picture of data work that can exist when you have excellent descriptive analytics in place. When the foundation is there you have the conditions required to find insights and make predictions. That is a promised land few companies have achieved.
Talking only about large companies with heavily staffed data teams that are primarily focused on insights and prediction, without the necessary context of their descriptive reporting practices, is like talking about the workout routines of Tom Cruise and Glen Powell. What works for them is not very useful for the majority of the population.
Most people and organizations need Pareto principle advice: simple instructions that build a solid foundation (i.e. eat less, move frequently, sleep adequately).
The majority of people and organizations are not going to have data teams – either by ignorance of what they can achieve with them or because they cannot justify the expense of them. Yet I believe that those companies without data teams deserve the outcomes of having a great data team, even if they cannot afford one. Similar to how every company, in an ideal world, would love to have the greatest engineers, product managers, lawyers, accountants, marketers, and salespeople so they could produce the best outcomes in those fields – they want to have the best data people too.
Reality says that the best people are expensive which makes the best outcomes expensive. So how do we make things less expensive? How do we bring it to more people?
We build an assembly line.
What is an Analytics Assembly Line?
First, let’s define what a generic assembly line is. There are 6 main components that minimally define an assembly line:
High Demand – consumers must want enough of a product to justify investment
Budget Constraints – existing options must be too expensive for many consumers
Raw Materials – raw materials must be available to feed into the assembly line
Standardized Construction – it must be possible to move raw materials through consistent steps to create a final product
Humans or Machines – humans or machines must be able to make the final product from raw materials
Standardized Delivery ��– it must be possible to deliver the final product to consumers at the same rate of generation
Based on this list, I believe analytics fits into this model.
Tristan does not define what exactly he means by analytics as an assembly line. For me, the insinuation is that it’s a pejorative term. I’m taking a different approach by drawing out the positives in the combination of analytics and assembly lines. The assembly line transformed our world and brought many great products to more people, so it’s not immediately obvious that an assembly line for analytics is a bad thing.
I’m familiar with at least one attempt at defining it, but that doesn’t quite hit the mark for me. My thinking on this is strongly influenced by the CommonCog articles listed above. In a world where you really believe in statistical process control, then you believe that your business is a process, and you therefore believe that measuring the business is the beginning of knowledge.
If you believe all that, then the case for there being such a thing as an analytics assembly line becomes stronger to make. So let’s dig into why the assembly line framing makes sense for analytics.
Why an Assembly Line?
Assembly lines make products less expensive
Every great product that most people can afford is made on some kind of assembly line. Humans have become really good at understanding the end state for a product, breaking down the process to make repeatable steps, and then lining up those steps so large numbers of product can be made as inexpensively as possible.
We severely need this in data. Data solutions and outcomes are still too expensive, even with AI.
Having an assembly line mentality is an acknowledgement that the demand for “data insights” will always be greater than your capacity and that you are aiming to be as efficient and effective as possible while still maintaining a high bar for quality.
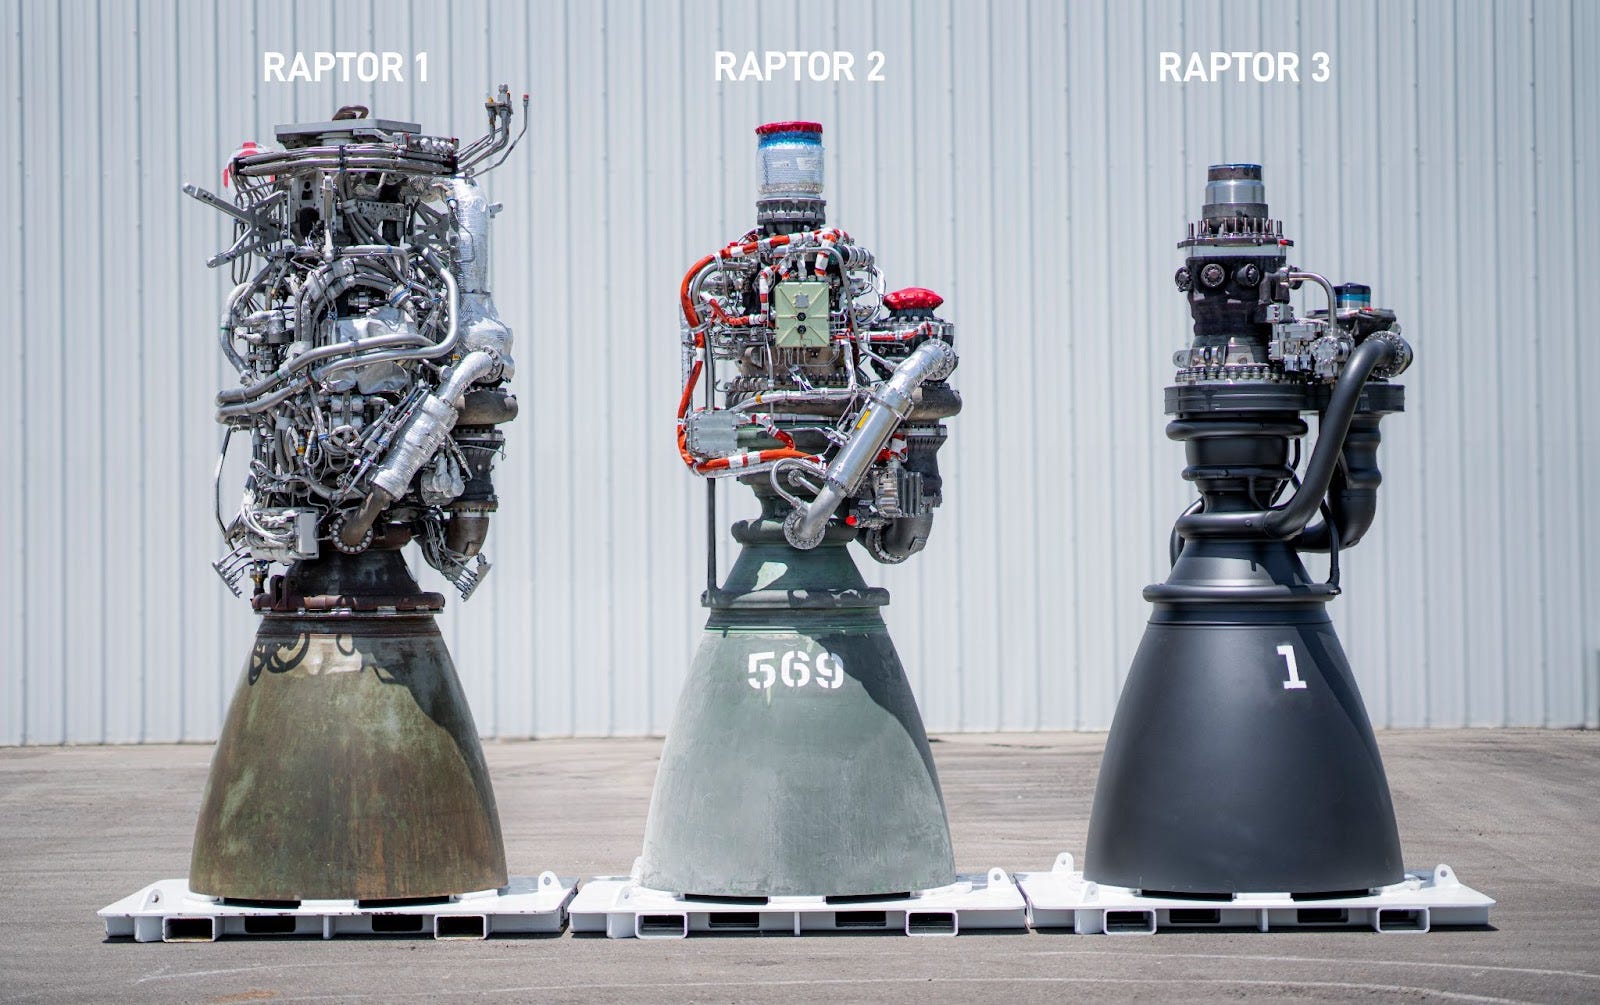
Assembly lines make good products inexpensively. Analytics deserves the same.
The product of an assembly line that has been iterated on over several years.
Most companies aren’t unique
I’ve been spending a lot of time recently talking to people running very complex dbt projects and data infrastructures. These are companies who are at the intersection of some of the thorniest data problems in the world, requiring not just advanced analytics systems but also the sociotechnical patterns to enable them.
Most companies are not running “very complex dbt projects and data infrastructures”. Nor are they unique in their offerings. There are many competitors and many companies that will do the exact same thing just with different branding.
Those companies should be measured the same way. They care about the same metrics. Revenue. Pipeline. Bugs. Support tickets. A very large portion of what the company does can be expressed by a metric that is not novel and simply needs to be measured and automated.
What is the product of an Assembly Line?
Metrics are our end product
Descriptive analytics are about defining and measuring metrics. These metrics are the product of an analytics assembly line. All companies need to care more about their metrics. The majority of any analytics journey needs to be focused on aligning the team about what to measure, what to call it, and how to handle any particular edge cases. I believe GitLab (yes, I’m biased) has done a great job of publicly showcasing the metrics, aka KPIs, that they care about.
By centering the metric we align a group of people on what results should be measured. It’s easy to say. And it should be easier to do.
But why metrics?
For a deeper dive on why metrics are important, I refer you to the prerequisite reading. The key takeaway though, is this: for any post-PMF business, there is no true knowledge (or “insight”) to be gained prior to having processes measured. Processes are measured with defined metrics.
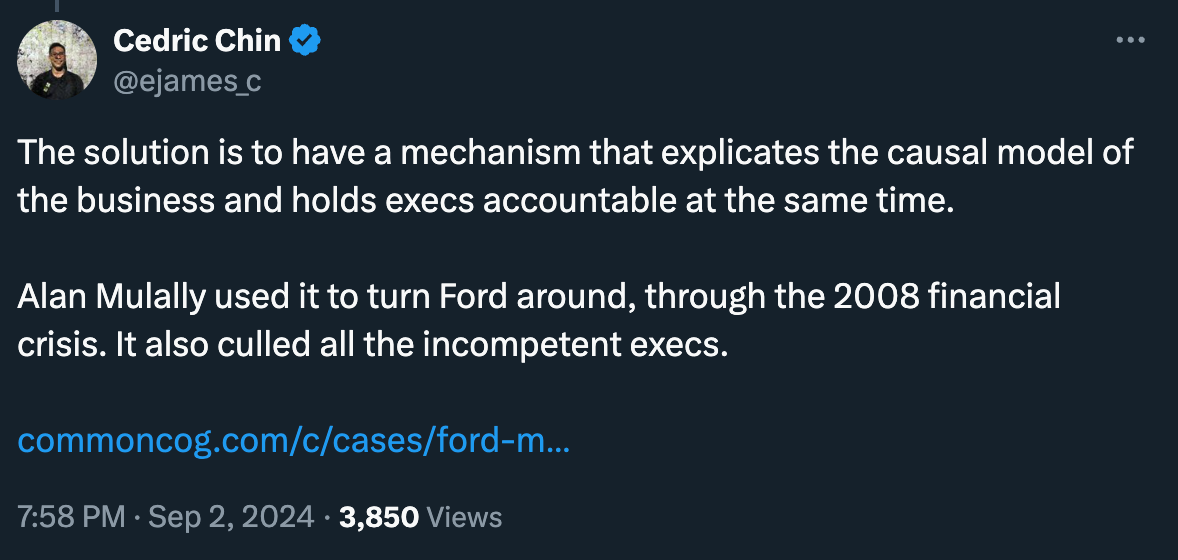
Cedric compellingly makes the case that the thing that truly matters are the causal mechanisms that drive your business.
In a startup, well-defined metrics are less important as iterations are quick and qualitative data trumps most everything. But even in a startup, your intention should still be to drive towards understanding what works to move your business. Metrics are the best way to do that.
In an assembly line view of analytics, you’re saying that an organization is a process and we’re simply working to track, measure, and control every part of that process we can.
What about insights?
Data people love talking about insights. But in the vast majority of data-driven companies, insights are built on a solid foundation of descriptive metrics. Tristan argues:
“When you try to treat analytics like an assembly line you do get predictable outcomes (likely dashboards!), but not insights that drive ROI.”
This is patently false. Insights happen when you’ve consistently measured the business over time via metrics and you have knowledge about what the controllable levers are that meaningfully move the metrics. Insights are found within and between metrics that show exceptional variation. That’s a signal that something has happened in the business and you should investigate. But that only happens when you have your metrics in place.
There are no insights without the metrics (and their dashboards!).
What about dashboards?
Dashboards are not the product of data teams. Dashboards are one way to visualize metrics. Every data professional has a story about a dashboard they spent weeks to build that was used once and then abandoned. It’s a miserable feeling. You should push for alignment on metrics first before ever building a dashboard1.
So, what about the rest of the analytics assembly line?
Recall what the minimum components of an assembly line are:
High Demand – consumers must want enough of a product to justify investment
Budget Constraints – existing options must be too expensive for many consumers
Raw Materials – raw materials must be available to feed into the assembly line
Standardized Construction – it must be possible to move raw materials through consistent steps to create a final product
Humans or Machines – humans or machines must be able to make the final product from raw materials
Standardized Delivery – it must be possible to deliver the final product to consumers at the same rate of generation
Well, based on everything we’ve discussed, does analytics meet these requirements?
High Demand – the demand for analytics in well-run organizations is high. Always will be. I also believe that less expensive metrics will induce demand for more analytics.
Budget Constraints – the talent pool for skilled data professionals is expensive. Many tools for generating metrics can be expensive (especially if implemented poorly).
Raw Materials – data is plentiful. Most of it is available to be moved to an appropriate place to be worked on.
Standardized Construction – most companies have the same metrics and they should be calculated in mostly the same way. I plan to dive deeper into this in future posts. It is possible to standardize the construction of metrics and we should strive for this.
Humans or Machines – there are many people that can do data work and AI2 is an accelerator for them. It’s possible to build the machines that build the metrics.
Standardized Delivery – modern BI and Excel are perfect ways to deliver metrics
I believe that analytics fits into an assembly line framing quite well.
What does “Standard Construction” look like in an analytics assembly line?
This is the part where I suspect you will be the most skeptical. Indeed, the default assumption with data work is that it all falls under the model Tristan described:
“Analytics is an iterative process that involves asking and answering questions, gathering data, poking at it, getting curious, getting stuck in dead ends, and realizing that the fact you learned way over here is actually the answer to this question way over there.”
That sounds anathema to a “standard construction”. But if you’re with me so far then you may realize that for so many questions that businesses have it’s just not so. A few data questions at some companies will match this pattern. But many won’t and nor should we want them to.
Simply measuring the business shouldn’t be such a mysterious and nebulous art. It should be more engineering than science. Standard construction is possible because descriptive metrics are no more and no less than instrumenting, gathering, and then presenting such metrics to operators. With a few relatively simple frameworks (such as input vs output metrics, and exceptional vs routine variation), business operators will actually be empowered to figure out the causal model of their departments. This type of work is something data teams are amply capable of doing. In fact, the great progress in data tooling over the last decade makes this even easier to achieve.
I will have more follow-up posts in the future that go into detail about what the standard construction of metrics via an assembly line looks like both within a company (via a data team) and outside of a company (via vendors and consultants).
The best case for Tristan’s argument
I want to touch briefly on part of what makes Tristan’s argument compelling. It’s intellectually appealing to think of an analyst’s job as searching for an insight deep in the haystack of messy data. We imagine we’ll have the moment of Eureka! and the insight we generated will change the trajectory of the company for the better.
I enjoy that idea too. We admire our colleagues who’ve been able to spend a week diving into different data sets, combining them in some notebooks, modeling different scenarios, and doing the hard, investigative work of “analytics”. They come back from their time in the desert having achieved a new Insight for the business. I’ve done this in the past myself. It’s very fun!
But if you don’t have a foundation of metrics that measure your business first, then it’s not a winning strategy for the organization. From Cedric’s post:
“When Wheeler says that usage of process behaviour charts is the ‘beginning of knowledge’, what he means is that such charts should lead you — and your organisation! — to ask the kind of questions that will slowly build into a causal model of the business in your heads. Over time, consistent and repeated investigation of exceptional variation (plus removal of said variation) should lead you to a better understanding of the various subsystems in your business. Which in turn means that you should be able to understand how all those systems fit together — so you may predict how modifying one aspect of that system would affect all the other aspects that are connected to it.”
To translate this into the language of this post:
Defined metrics, measured over time, enable you to create hypotheses about what drives the business forward. Do this repeatedly and you will get closer to true knowledge of the system.
This is where Tristan’s “curiosity, flexibility, and integration” work of a data professional can come to life. But that life can only exist and thrive when you have the foundations in place.
Most companies don’t have the foundations that will support true knowledge.
Metrics are not the outcome of the data function
A key point in the strongest framing of Tristan’s argument is that good metrics are necessary to deliver the outcome of a great data team but they’re not the whole story. Cars are made on an assembly line but we don’t simply deliver them to people without training and appropriate infrastructure in place. Similarly, there is a required mindset and operations shift required for operators to use metrics consistently to drive their business forward. This is not easy but it is possible.
My plea to data professionals
My aim with this post is to get you to believe it’s possible that analytics can and should be done differently. I want you to believe that more people and companies deserve the outcomes of high performing data teams. I want you to believe that better descriptive analytics via metrics (and more specifically via statistical process control) is the best way to do this. And I want you to believe that bringing better metrics to more people as cheaply as possible is a thing worth doing.
An unspoken part of this whole thing is that some view an assembly line as a miserable contraption that sucks the soul out of anyone who works on it. I reject that notion and believe it’s possible, especially in software and data, to build an analytics assembly line that brings tremendous value to everyone that comes in contact with it.
For too long we’ve been obsessed with the skills we have and the knowledge that we are gatekeepers to. As a data community, let’s focus more on delivering great results for more people instead of the unrelatable problems of the few.
Thanks
Special thanks to everyone who read drafts of this article and/or inspired me with their own writing, especially Emilie Schario, Jacob Matson, Ergest Xheblati, Abhi Sivasailam, Cedric Chin, and the Locally Optimistic community.
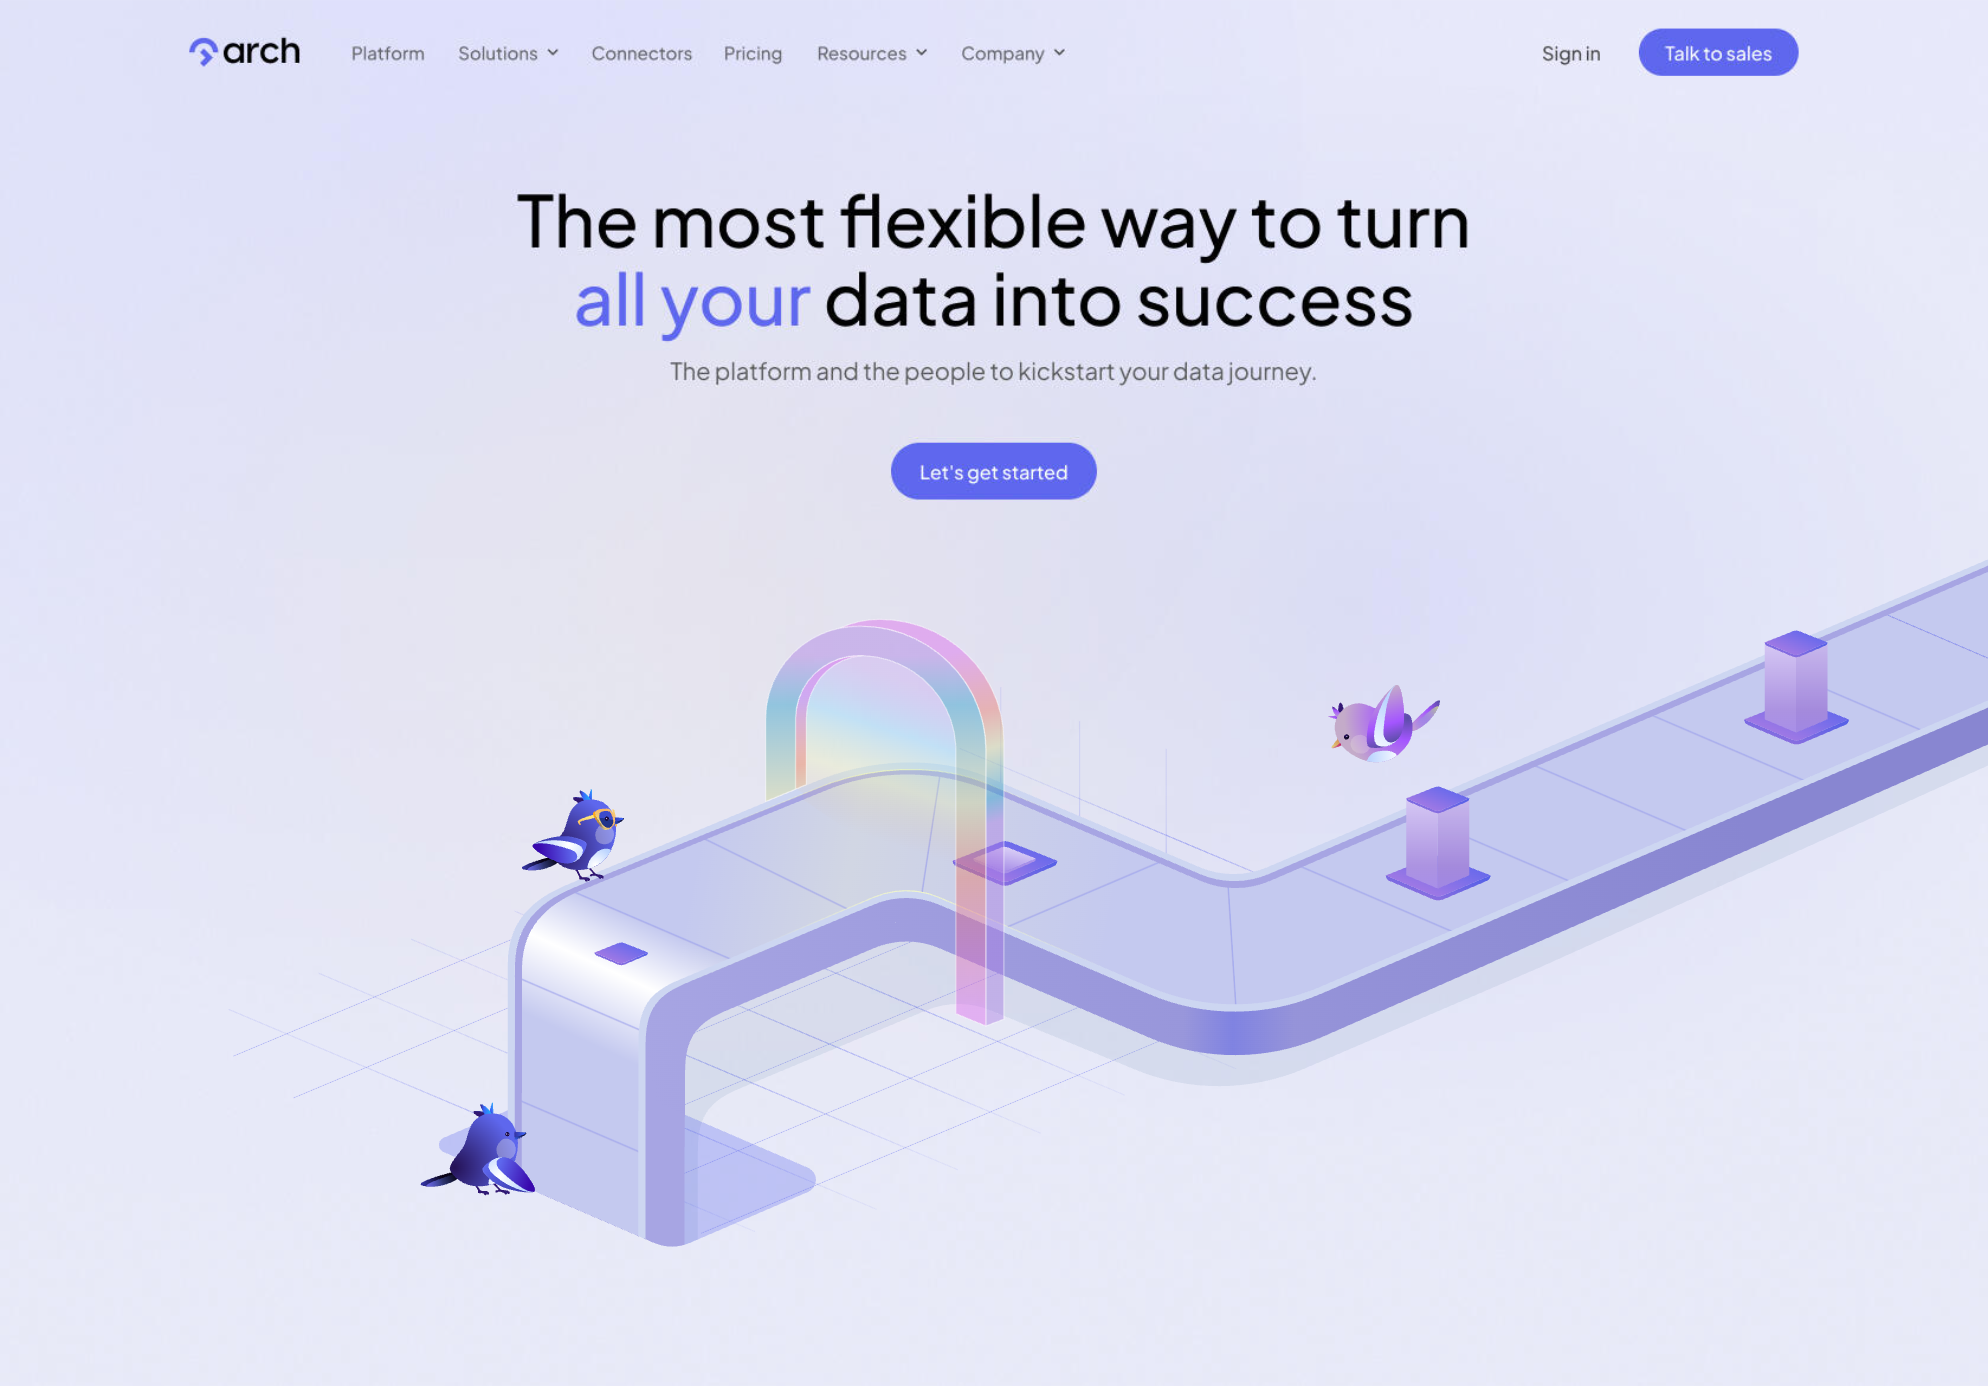
PS. Separately from this article we’ve been iterating on our messaging and branding at Arch. Prior to Tristan publishing his post we landed on this assembly line design because it spoke to how we were approaching this problem. The post, plus a confluence of our design efforts and other conversations made me want to dig into this topic. I love where the branding efforts have taken us and I’m proud of the team and what they’ve created.
Incidentally, this is why BI is such a tough business. When you’re aligned on the metrics and how they relate to each other, you don’t need fancy BI. The causal relationships between metrics are already defined and visualization is a necessary, but relatively simple step. ↩︎
Won’t Artificial Intelligence handle all of this?
No. Artificial intelligence is an accelerator for every part of this.
I’m bullish on how the current state of AI will help accelerate analytics access for everyone. Good products with thoughtful AI can make this process better. And a foundation of metrics is necessary for good insights and outcomes with AI interfaces. AI can do a lot, but it won’t do everything and businesses still need people in them. ↩︎
Foreword
Introduction
What is an Analytics Assembly Line?
Why an Assembly Line?
Assembly lines make products less expensive
Most companies aren’t unique
What is the product of an Assembly Line?
Metrics are our end product
But why metrics?
What about insights?
What about dashboards?
So, what about the rest of the analytics assembly line?
What does “Standard Construction” look like in an analytics assembly line?